Full Customer Journey
Graphic illustrating that the customer journey is no longer a straight line as traditionally shown, it has become more convoluted with more steps and touchpoint opportunities along the way.
Email A / B Testing
Showcasing the purpose behind A / B testing in email outreach, and how email optimization can have a large impact in marketing.
Personalized Medicine
One of the most interesting new applications for AI in healthcare is personalized medicine, where the standard care isn’t “one treatment fits all”, and the treatment is tailored to the patients’ age, gender, health, etc. This graphic shows how personalized medicine works in a simplified form.
CDP Data Sources & PErsonalization
Illustrating the various data sources that a Customer Data Platform (CDP) can take in and how they can use that data to output a personalized customer experience.
Bot Traffic Breakdown
Anyone with analytics on their website knows that much of their traffic is invalid, but there are many different types. This graphic seeks to show the list of types in a more engaging way than a bulleted list in a block of content.
Multichannel marketing vs. Omnichannel Marketing
Multichannel Marketing and Omnichannel Marketing are easily confused concepts and the terms are sometimes used interchangeably. This graphic seeks to help explain the difference in a quick, easily scannable way.
Personalized AI
Showing examples of input data a personalized AI solution can take into consideration when creating a customer-personalized recommendation.
Marketing Analytics
This graphic illustrates utilizing marketing analytics (specifically Google Marketing Analytics in this case) to fully understand customer behavior and optimize campaigns.
Analytics to Actionable Insights
An analytics implementation does not good if you don’t know what do with the data it creates for your organization. This graphic shows that using Further to help make sense of your data can lead to actionable insights for your business.
Population vs Sample Size
Quick illustration that gives a scannable, easily identifiable visual definition of the difference between the two digital marketing terms.
Research & Experimentation
Visual concept showing that research and experimentation on your website leads to better user experience and hopefully, higher conversion.
Email Best Practices
Instead of a list of text telling blog readers what the best practices for email are, this graphic shows what some of the best practices for email marketing are.
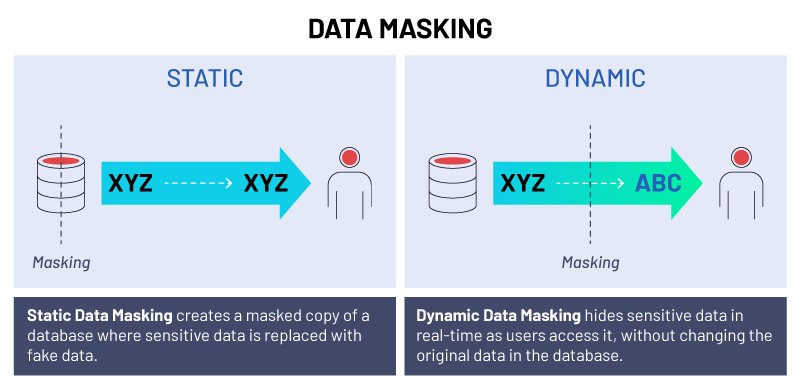
Data Masking
Explaining the difference between static and dynamic data masking, and how the different methods can have an impact on the security of your stored data.
Target Market vs. Target Audience vs. Target PErsona
Target markets, audiences, and personas are all part of a marketing strategy, but are another collection of terms that can used interchangeably and the specific definitions can get muddy. This graphic explains the differences and their roles in a personalized marketing campaign.
Business Intelligence
Showcasing the components that combine to create the umbrella of Business Intelligence.
AI Powered Privacy Assessment
Visual showing some of the data sources that an organization could be collecting from, that inherently have risk associated with them, and a simplified process flow through an AI-powered privacy risk assessment that generates a mitigation plan to greatly reduce risk.


